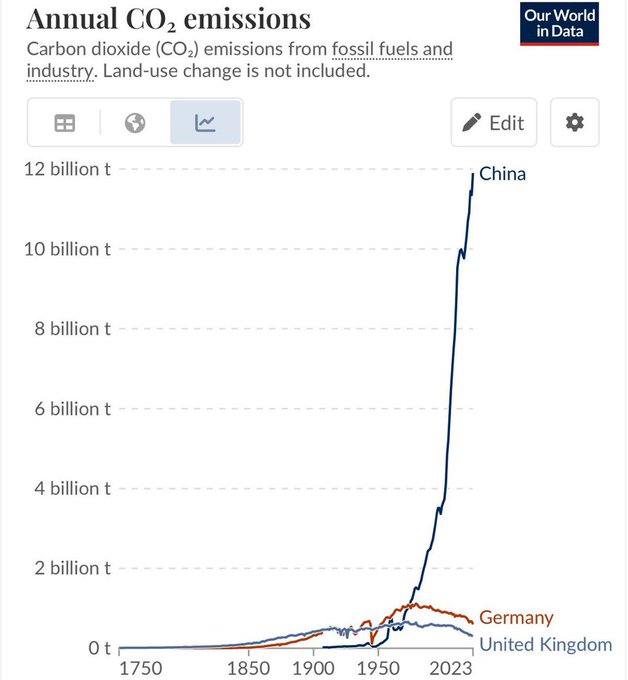
Lefties are destroying their economies over nonsense.
Share this:
- Share on X (Opens in new window) X
- Share on Tumblr (Opens in new window) Tumblr
- Share on Reddit (Opens in new window) Reddit
- Share on Pinterest (Opens in new window) Pinterest
- Print (Opens in new window) Print
- Email a link to a friend (Opens in new window) Email
- Share on Facebook (Opens in new window) Facebook


